Join the Waves of Change Global Campaign! Learn More
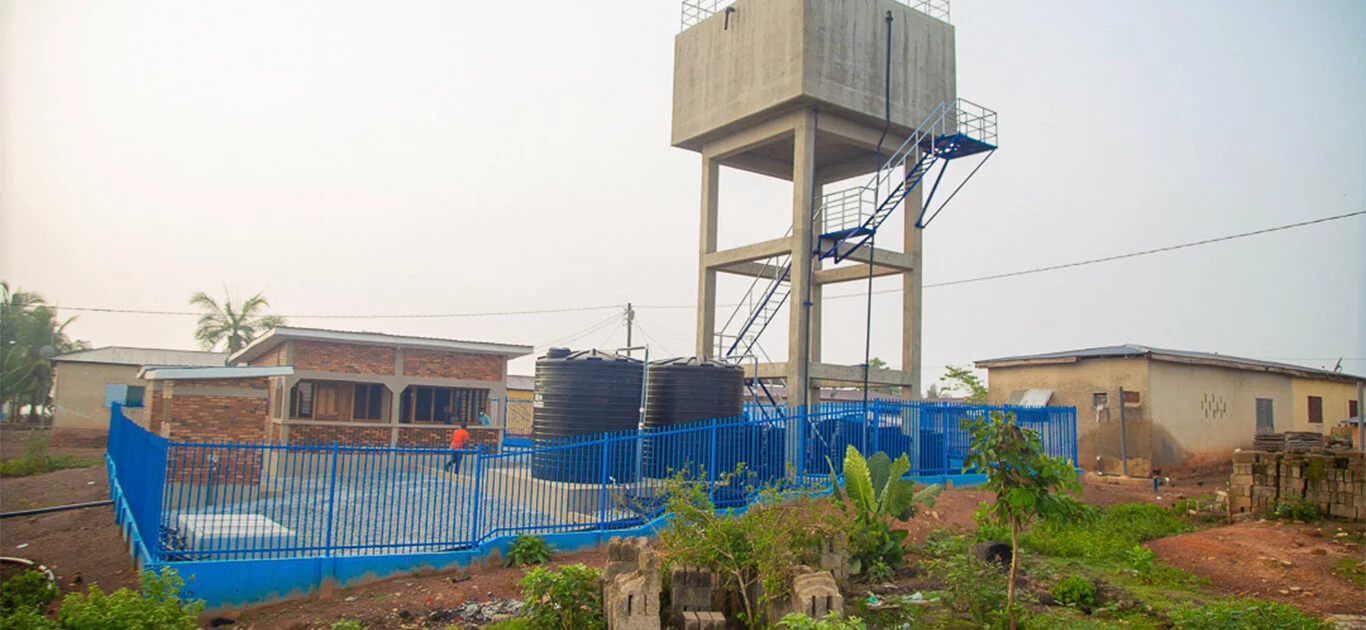
Since 2009, Safe Water Network has led the growth of safe water enterprises in Ghana. We work with communities, government agencies, development partners, and other stakeholders to develop and replicate sustainable solutions to the supply of safe water.

445,000
People
reached through direct access

8
Years
of hosting national Beyond the Pipe Forum events

2,000+
Piped Connections
to homes, schools, and health clinics

95+%
station uptime

143
communities

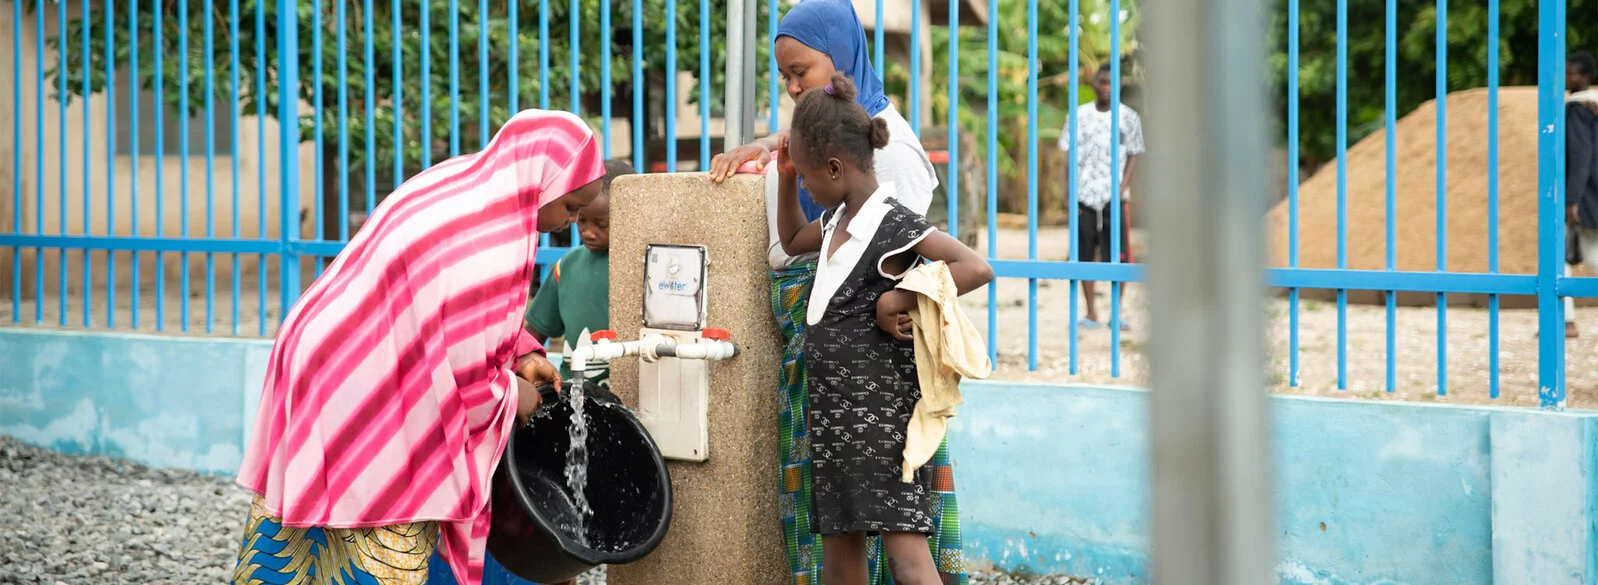
Our brand in Ghana, H20ME!, stands for quality, reliability and affordability. We work with community leaders and local governments to establish trust in our services, and regularly survey station operators and community members to measure satisfaction with service and taste.
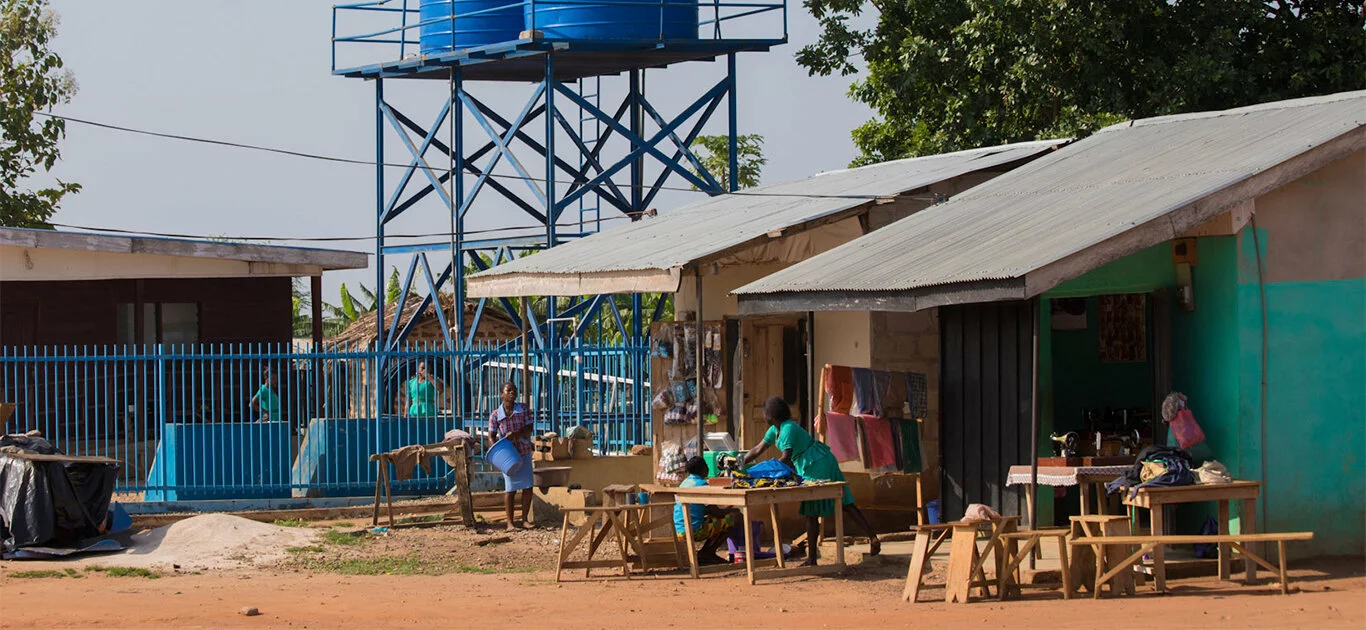
Our piped-connection program provides households, schools, health clinics, and businesses with convenient access to safe water.
Through our integrated operating platform, we improve efficiency for our station operators and promote digital payment technologies. Digital transactions allow for more security and financial planning, while creating a feedback loop with our customers so we can improve service delivery.

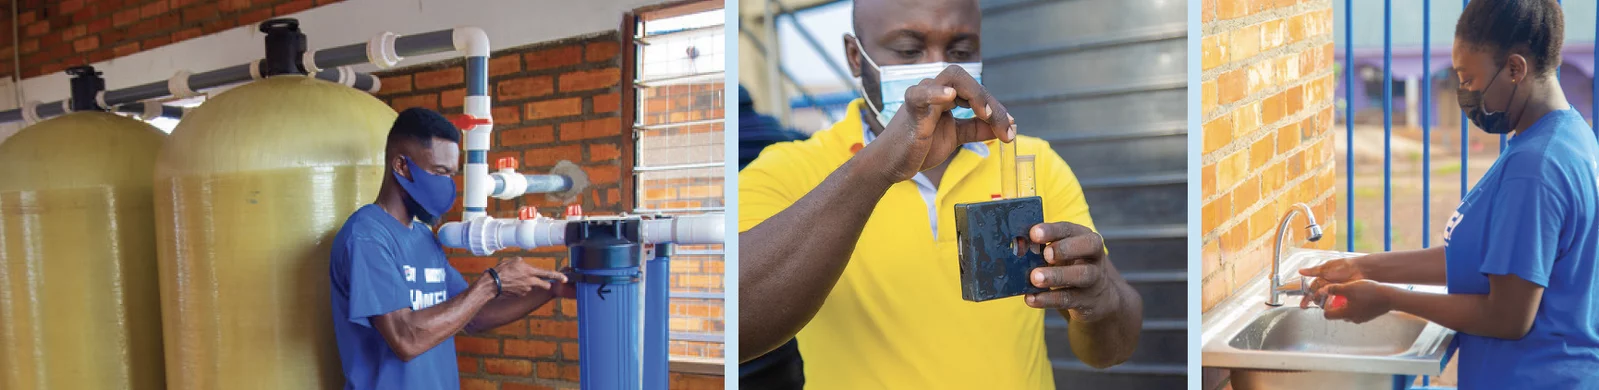
Safe Water Network works closely with Ghana’s Community Water and Sanitation Agency, District Assemblies, community groups, and the private sector to build capacity and replicate proven practices. Our core capabilities are in operational efficiency, financial management, performance analysis, and water quality assurance.

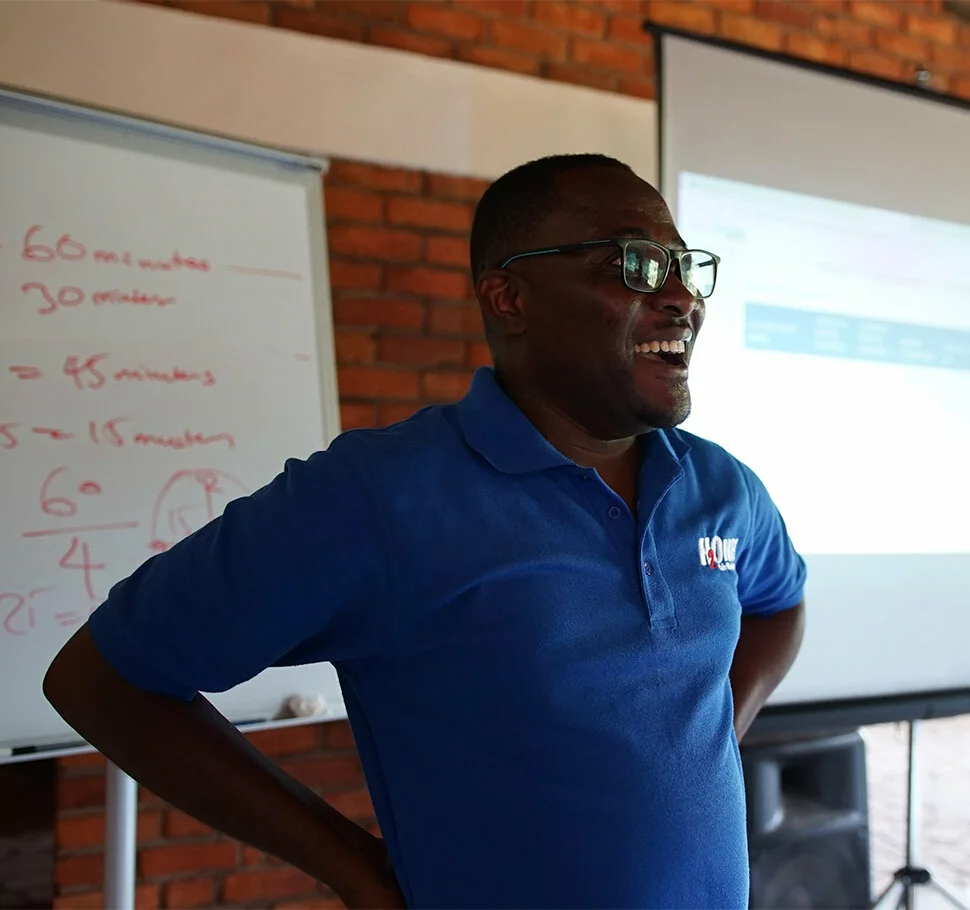
We engage with local and national authorities to support the development of a financial and regulatory landscape that accelerates progress toward universal access to safe water. Our forums and workshops are informed by insights from market assessments, policy research, and a multi-sector working group, which unites members with diverse expertise and perspectives from across the national water sector. Since 2012, Safe Water Network has hosted annual Ghana Beyond the Pipe Forums to identify and implement actionable solutions for growing safe water enterprises.
From our country office in Accra, we deploy field personnel to provide the support and leadership required to promote the safe water enterprise model across Ghana.
The most recent publications on our work in Ghana.

Making Piped Water to Households Affordable and Available
Insights from the Free Water Mandate in Ghana
Safe Water Resilience Toolkit
News & Updates
All Ghana Stories